


It is non-negotiable in today's fast-paced digital environment to ensure your software applications work correctly under a variety of scenarios. Users want applications to be responsive, dependable, and high-performing, and a single performance flaw can damage your brand. Performance testing comes into play here. In this detailed introduction, we will delve into the world of performance testing with Apache JMeter, a versatile and open-source tool that may assist you in ensuring your software fulfills its performance objectives.
What Is Performance Testing?
Performance testing is an important part of software testing that analyzes an application's responsiveness, stability, and scalability under various scenarios. It's similar to software stress testing in that the purpose is to drive the application to its limits in order to uncover bottlenecks, detect performance issues, and confirm the product can manage a given load.
The primary objectives of performance testing are:
Responsiveness: To measure the application's response times under normal and peak loads.
Stability: To ensure the application remains stable and reliable during extended periods of use.
Scalability: To assess the application's ability to handle increased load by adding more users, transactions, or data.
Why JMeter?
Apache JMeter is a popular choice for performance testing due to its versatility and extensibility, as well as the fact that it is open-source and free to use. It has a user-friendly interface that makes it accessible to both novice and professional testers. JMeter is capable of testing a web application, REST API, or database.
Now, let's dive into the practical aspects of using JMeter for performance testing.
Getting Started with JMeter
Installing JMeter
Before we can start performance testing, you need to install JMeter on your local machine. Thankfully, the process is straightforward.
Download JMeter: Visit the official Apache JMeter website and download the latest version of JMeter.
Install JMeter: Unzip the downloaded package to your preferred location on your computer. You don't need to install JMeter; just unzip it, and it's ready to use.
JMeter User Interface
Once you've installed JMeter, you'll be greeted by its user-friendly interface. It might look a bit intimidating at first, but don't worry; we'll guide you through it.
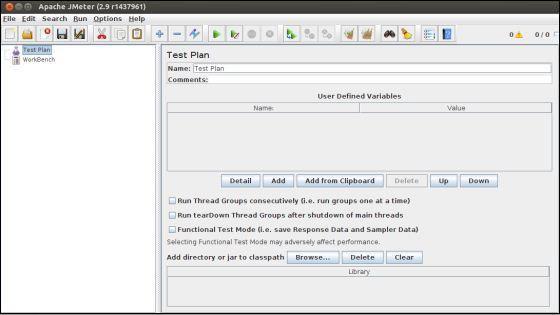
Test Plan: This is where you create and organize your tests. It's like a container for all your test elements.
Thread Group: Think of this as your group of virtual users. It defines how many users will simulate interactions with your application.
Sampler: These elements represent the types of requests your virtual users will make to your application, like HTTP requests.
Timers: Timers add pauses between requests to simulate realistic user behavior.
Listeners: Listeners capture and display the results of your tests.
Creating Your First Test Plan
The first step in using JMeter is to create a test plan. A test plan is essentially a blueprint for your performance tests. It defines what you're going to test and how you're going to test it.
Open JMeter: Launch JMeter by running the jmeter.bat (for Windows) or jmeter.sh (for macOS and Linux) file from the JMeter bin directory.
Create a Test Plan: In the JMeter interface, right-click on "Test Plan" and choose "Add > Threads (Users) > Thread Group" to create a thread group.
Add a Sampler: Right-click on the Thread Group, choose "Add > Sampler," and select "HTTP Request." This is where you specify the details of your web requests.
Building Test Plans
Adding Samplers
Now that you've created a test plan, it's time to add samplers to simulate interactions with your application. In this section, we'll focus on HTTP Request samplers, which are commonly used for web applications.
Right-click on your Thread Group: In the test plan tree, right-click on your Thread Group, choose "Add > Sampler," and select "HTTP Request."
Configuring the HTTP Request: With the HTTP Request added, you can configure it to make requests to your web application. Here are the key settings to fill in:
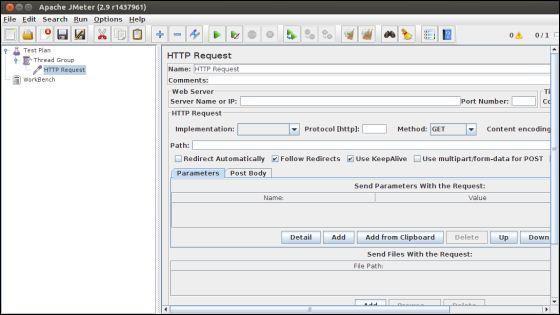
Name: Give your request a descriptive name.
Server Name or IP: Specify the domain or IP address of your web server.
Port Number: Enter the port number (usually 80 for HTTP or 443 for HTTPS).
Path: Define the path to the resource you want to access (e.g., "/login" for the login page).
Method: Choose the HTTP method (GET, POST, etc.) for your request.
Adding Listeners
Listeners in JMeter allow you to view and analyze the results of your tests. Let's add a listener to see how our HTTP Request sampler performs.
Right-click on your Thread Group: Once again, right-click on your Thread Group, choose "Add > Listener," and select "View Results Tree."
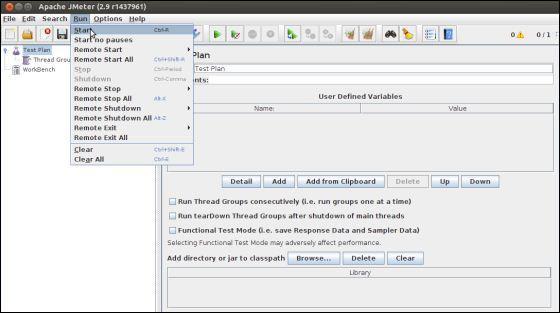
Running the Test: Before we proceed further, it's a good idea to run your test at this point to ensure that your HTTP Request is functioning correctly. Click the "Run" button (a green triangle) in the toolbar.

Configuring Users
In performance testing, you simulate multiple users accessing your application simultaneously. Let's configure the number of users for your test.
Thread Group Settings: In your Thread Group, you can set the number of threads (users) and loop count (the number of times each user repeats the test) to simulate various scenarios.
Run the Test Again: Rerun your test with the updated number of users. The View Results Tree listener will display the results for each user.

Now that you've set up your test plan, added an HTTP Request, and configured users, you can start performance testing your web application. Run the test to gather data and analyze the results.
Analyzing Results
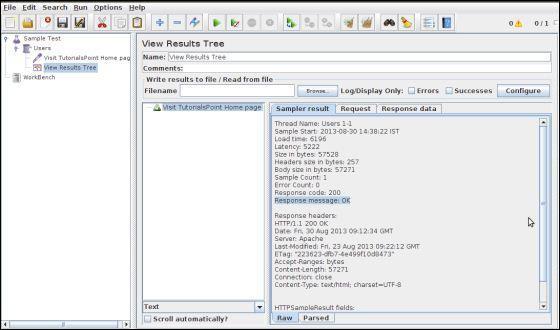
View Results Tree
The View Results Tree listener provides detailed information about each request made during the test. It displays data such as the response time, response code, and response message.
Response Time: This indicates how long it took for the server to respond to the request.
Response Code: The HTTP status code returned by the server, which can be used to identify errors.
Response Message: A brief description of the server's response.
Summary Report
In addition to the View Results Tree, JMeter offers the Summary Report listener. This listener provides an overall summary of your test, including the number of requests, response times, and error counts.
Add Summary Report Listener: Right-click on your Thread Group, choose "Add > Listener," and select "Summary Report."
Run the Test: Rerun your test, and this time, you'll see the Summary Report listener's output, which summarizes the test results.
Advanced JMeter Features
Parameterization
Parameterization allows you to test your application with various inputs to simulate different user scenarios. In JMeter, you can use CSV files to provide test data for parameterization.
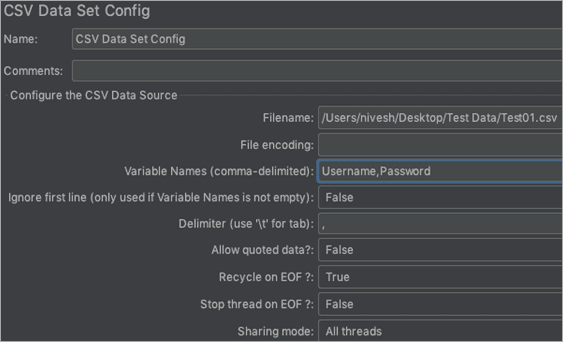
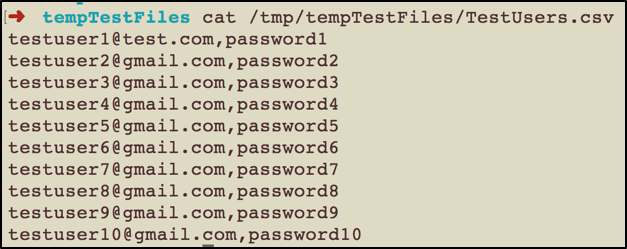
Set Up a CSV File: Create a CSV file with different sets of test data, such as usernames and passwords.
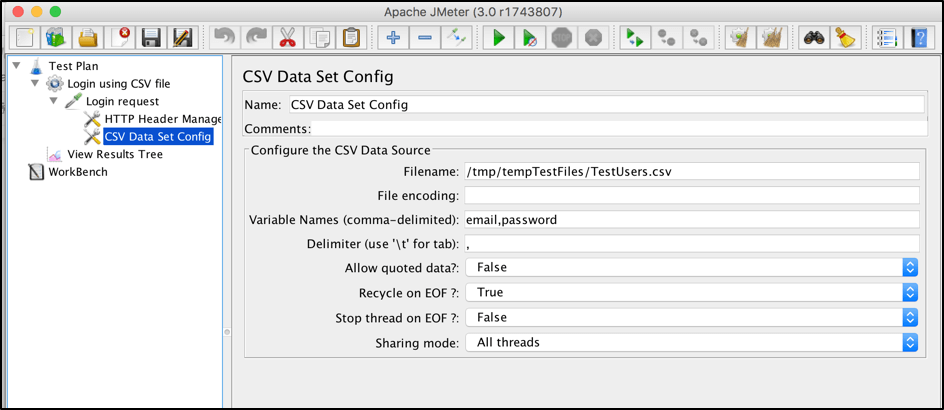
Add CSV Data Set Config: In JMeter, you can configure the "CSV Data Set Config" element to read data from your CSV file and use it as a parameter in your requests.
Assertions
Assertions are used to validate the responses received during your test. JMeter provides various assertion elements that allow you to set criteria for the expected responses.
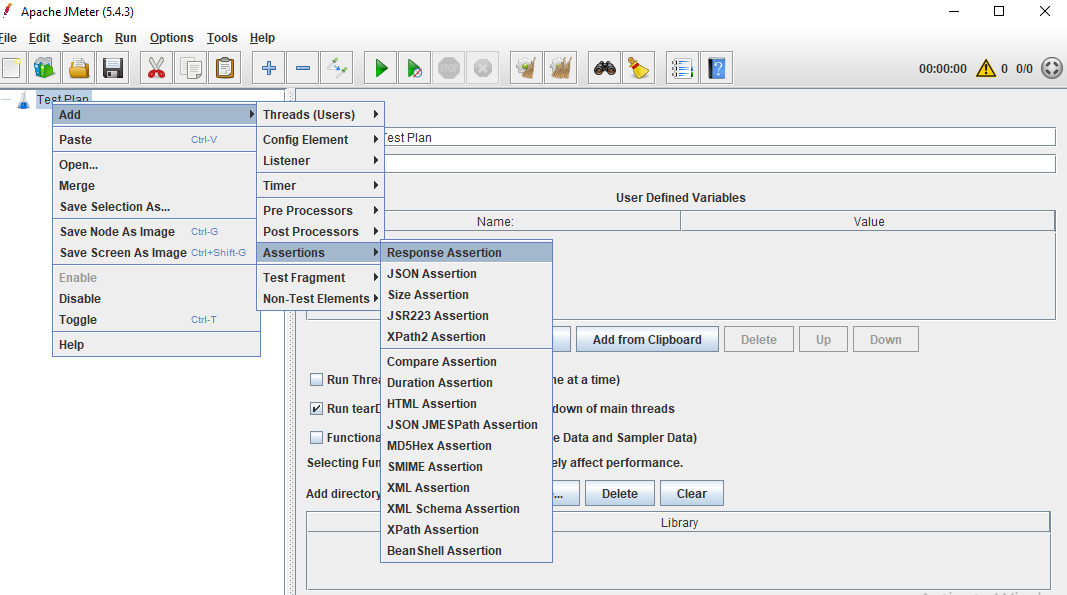
Add an Assertion: Right-click on your HTTP Request sampler, choose "Add > Assertions," and select the type of assertion you want to use.
Configuring Assertions: Configure your assertion to check specific conditions in the response, such as response code, response time, or text.

Parameterization and Advanced Testing
Parameterization in HTTP Requests
Once you've configured the CSV Data Set Config, you can use the variables from the CSV file within your HTTP Requests. This is especially useful for simulating different user logins or data inputs.
Open the HTTP Request Sampler: In your Thread Group, select the HTTP Request sampler where you want to use the parameterization.
Use Variable Names: In the request fields, use the variable names you defined in the CSV Data Set Config element by enclosing them in ${}.
Run the Test: Now, when you run your test, JMeter will use data from the CSV file to populate the HTTP Request fields, simulating different user inputs for each iteration.
Advanced Assertions
Assertions play a vital role in performance testing by allowing you to validate responses from your application. JMeter provides several advanced assertion elements for fine-tuning your test scenarios.
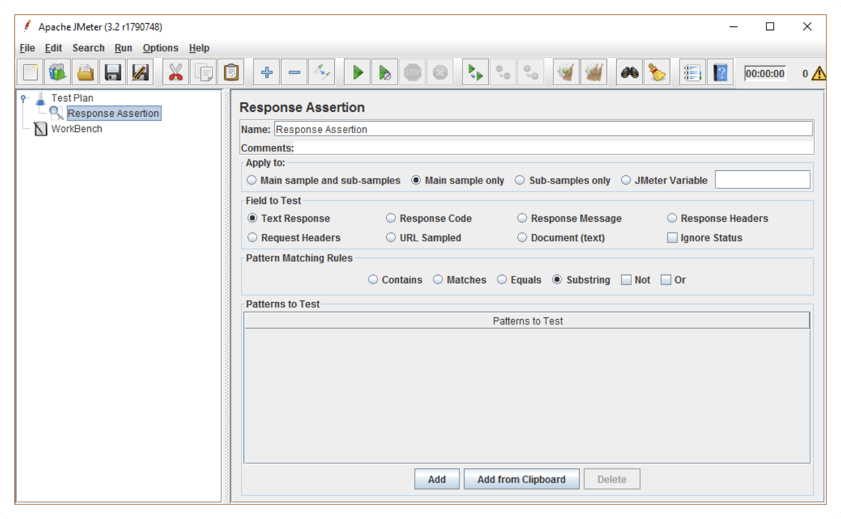
Response Assertion
The Response Assertion element allows you to check specific aspects of the server's response, such as response code or response data. This helps ensure your application returns the expected results.
Add a Response Assertion: In your HTTP Request sampler, right-click and choose "Add > Assertions," then select "Response Assertion."
Configure the Response Assertion: In the Response Assertion settings, define what you want to check, such as the response code or response data.
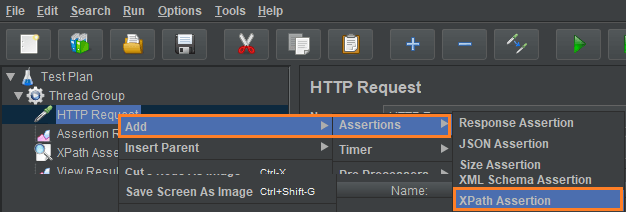
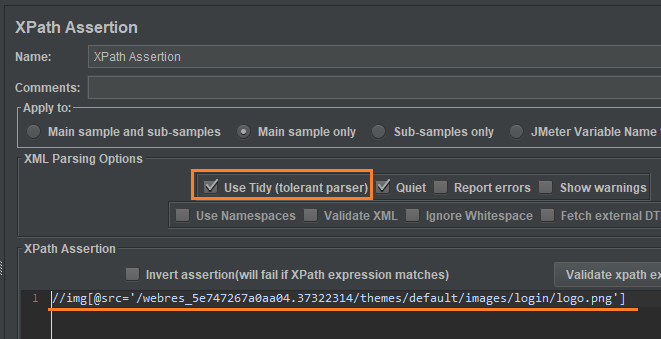
XPath Assertion
XPath Assertion is useful when you want to validate XML or HTML responses. It allows you to apply XPath expressions to check specific elements or values in the response.
Add an XPath Assertion: Within your HTTP Request sampler, add an assertion by choosing "Add > Assertions" and selecting "XPath Assertion."
Configure the XPath Assertion: Define the XPath query to select the element or value you want to validate.
Other Advanced Features
JMeter offers a wide range of advanced features, such as distributed testing, continuous integration, and scripting for more complex test scenarios. Exploring these features allows you to fine-tune your performance testing to match your specific requirements.
Distributed Testing and Continuous Integration
Distributed testing is a powerful feature in JMeter that allows you to simulate a large number of virtual users by distributing the load across multiple machines. This is particularly useful when you need to test the performance of your application under heavy traffic.
Setting Up a JMeter Cluster
To perform distributed testing, you need to set up a JMeter cluster, which consists of one master machine and multiple slave machines. The master coordinates and controls the test, while the slaves execute the test plan.
Install JMeter: Install JMeter on all the machines that will be part of your testing cluster.
Configure JMeter Master: On the master machine, open your test plan, and go to "Run > Remote Start." Configure the list of IP addresses or hostnames of your slave machines.
Start Slave Instances: On each slave machine, run JMeter and open the test plan. Go to "Run > Remote Start" and ensure they are connected to the master.
Run the Test: Back on the master machine, and start the test. JMeter will distribute the load to the connected slave machines.
Continuous Integration with JMeter
Integrating performance testing into your continuous integration (CI) pipeline is essential for detecting performance issues early in the development process. JMeter can be seamlessly integrated into CI systems like Jenkins.
Setting Up JMeter in Jenkins
Install Jenkins Plugins: Install the necessary Jenkins plugins for running JMeter tests, such as the Performance Plugin.
Create a Jenkins Job: Create a new Jenkins job for your performance tests. Configure it to execute a JMeter test plan as a build step.
Schedule the Tests: You can schedule the tests to run after code commits, periodically, or based on your CI workflow.
View Reports: Jenkins will generate reports with performance metrics and display them in the job results.
Advanced Scripting with Beanshell
Beanshell is a scripting language supported by JMeter that allows you to perform custom operations and logic within your test plans. You can use BeanShell to create dynamic test scenarios and complex data manipulations.
Add Beanshell Sampler: In your test plan, you can add a Beanshell Sampler to execute custom scripts. This can be useful for handling dynamic data or complex authentication processes.
Write Beanshell Code: In the Beanshell Sampler, you can write custom Beanshell code to perform the desired actions. JMeter provides access to various variables and functions within Beanshell scripts.
Run the Test: When you run the test, JMeter will execute the Beanshell script as part of your performance test.
Best Practices and Advanced Techniques
Welcome to the final part of our comprehensive guide to Apache JMeter. In this section, we will delve into best practices and advanced techniques to help you become a proficient JMeter user.
Best Practices
Test Planning: Before you start creating your test plan, spend time designing it. Define your objectives, target metrics, and user scenarios. A well-planned test will save you time and yield more accurate results.
Test Data: Use realistic test data to simulate real user behavior. Avoid using static data and consider parameterization to create dynamic tests.
Think Time: Introduce think time between user actions to mimic real-world scenarios. Users don't interact with a system instantaneously.
Assertions: Implement assertions to validate responses. Ensure that your application is functioning correctly under load.
Regular Maintenance: JMeter test plans should be periodically reviewed and updated. As your application evolves, your test plan may need to adapt accordingly.
Distributed Testing: For large-scale testing, consider distributing your test across multiple servers. This allows you to simulate a higher number of virtual users.
Advanced Techniques
Using Controllers: JMeter offers various controllers like the Logic Controller, Throughput Controller, and Runtime Controller. These can be used to create sophisticated test scenarios.
Parametrization: Use CSV Data Set Config or other methods for parametrization. This allows you to vary input data for different virtual users.
Regular Expressions: When extracting data from responses, master the use of regular expressions. They can be powerful tools for data extraction.
Listeners and Reporting: Explore advanced listeners like the Summary Report, View Results Tree, and Response Times Over Time. They provide detailed insights into test performance.
Custom Functions: JMeter supports custom functions. You can write your functions to generate data or manipulate variables in your test.
Integration with Other Tools: JMeter can be integrated with tools like Jenkins for continuous integration and Grafana for advanced reporting. Such integrations enhance your testing capabilities.
Monitoring System Resources: Use external monitoring tools to track server resource utilization while JMeter is running. This can help identify system-level bottlenecks.
Non-GUI Mode: Run JMeter tests in non-GUI mode for better performance. This is especially important for large tests.
Conclusion
Congratulations! You've finished our Apache JMeter tutorial. You may now run performance testing, analyze results, and optimize your apps for dependability and scalability using the knowledge you've obtained.
Remember that JMeter is a powerful and versatile tool, and your knowledge will expand as you apply it to various testing scenarios. Continuous learning and investigation of JMeter's features and capabilities will transform you into an expert performance tester.